Neighborhoods in cEA
The neighborhood of an individual is a set of individuals placed close to it on the grid. The neighborhood shape has a mayor impact on the behavior of the cEA. We will stand out two different neighborhood patterns:
 |
| Figure 1. Two examples of Linear neighborhood patterns |
 |
| Figure 2. Two examples of Compact neighborhood patterns |
In cEA, one given individual has its own pool defined by its neighbors, and at the same time, one individual belongs to many pools. The existence of these overlapped small neighborhoods helps in exploring the search space [SM91], and provides a smooth diffusion of good solutions along the grid.
The size of the neighborhood determines the speed of propagation of information between the individuals of a population, thus deciding between rapid propagation or maintenance of a high diversity/variability in the population. A higher variability is often desired, thus preventing problems such as premature convergence to a local minimum. Similar results were drawn from simulations in [VSB92]. Local selection in a small neighborhood performed better than local selection in a bigger neighborhood. Nevertheless, the interconnection of the whole population must still be provided.
In [SJ96] we can find a large study on the effects of the neighborhood size and shape in the performance of a cEA. Increasing the neighborhood size creates a larger overlap and decreases the propagation time. So propagation times are closely related to neighborhood size. Hence increasing local neighborhood sizes while keeping the grid size fixed should result in corresponding increases in selection intensity reflected by higher growth rates of the best individual. About the effect of the neighborhood size they concluded that selection intensity increases with increasing neighborhood size, but they suggest that neighborhood shape also plays an important role with the observation that the L9 and C13 neighborhoods exhibit nearly identical growth curves even though C13 is almost 50% larger than L9, as shown in Figure 3.
 |
| Figure 3. Effect of neighborhood size and shape with fixed population size |
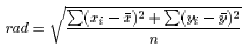
For studying the neighborhood shape, Sarma and De Jong defined the radius of a neighborhood based on a standard distance measure used in spatial analysis [Unwin81]:
 |
(1) |
which measures the spatial dispersion of a point pattern
and can be thought of as the radius of the circle centered on the mean center
![]() of a neighborhood
pattern of n points where
of a neighborhood
pattern of n points where
| (2) |
With this definition we can conclude that selection intensity increases with increasing the radius of the neighborhood. In Figure 4 we can see the neighborhood NEWS and the numeric value for its radius.
 |
| Figure 4. Radius of linear5 (NEWS) |
[SJ96] suggest that the similar effects should be observed if the neighborhood radius is kept fixed and the grid size decreases. Therefore [SJ96] concludes suggesting that the key factor in controlling selection intensity is the ratio of the neighborhood radius to the grid radius.